Ordered pairs as points on a plane
Let us understand how we can represent ordered pairs as points on a plane.
Take a look at the graph below:
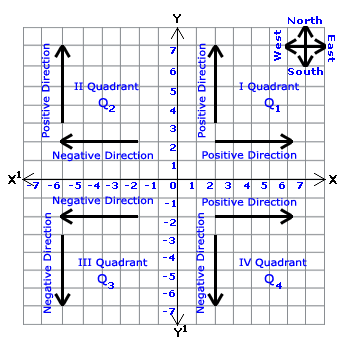
- You can see two lines - one horizontal and one perpendicular, dividing the graph sheet into four boxes (quadrants).
- The point of intersection is denoted as origin O.
- Each of these lines has positive and negative numbers on either side of the origin.
- The distance between each of these points is 1 cm.
- The horizontal line is called the x-axis and the vertical line is called the y-axis.
As you have seen, there are four quadrants - Q1, Q2, Q3 and Q4 in the anti-clockwise direction.
- The right-hand side toward east from the y-axis is considered the positive direction.
- The left-hand side toward west from the y-axis is considered the negative direction.
- The upward direction toward north from the x-axis is the positive direction.
- The downward side toward the south is the negative direction.
Given a graph such as this, every point in the plane can be denoted by a unique ordered pair.
Let's see how we can plot points on the graph by plotting an ordered pair set {(2,4) (2,3) (4, 3) (3, 2) (-2, 3) (2, -3) (-3 -2)}.
- The first number of the ordered pair represents the distance of the point from the x-axis and is called the x coordinate.
- The second number of the ordered pair represents the distance of the point from the y-axis and is called the y coordinate.
For example, to plot (2, -3), start from the origin and proceed 2 units toward the right side on the x-axis and then proceed 3 points downwards to reach the point (2, -3), which lies in the fourth quadrant.
This method of representing the ordered pairs in a plane was used by Rene Des Cartes (1596–1650), a French mathematician and philosopher. The axes are called coordinates axes and the plane is called coordinate plane or Cartesian plane, named after Cartes.
Example 1
Plot the following points on a graph sheet. What do you notice?
(2,1), (2,2) (2,3) 2,4) (2,5) (2,6) (2,0) (2,-1) (2,-2) (2,-3) (2,-4) (2,-5) (2,-6).
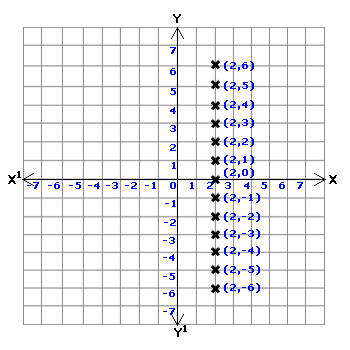
- All of the points lie on a straight line, which is perpendicular to the X -axis.
- All of the points lie on a straight line, which is parallel to the y-axis and 2 units from the y-axis.
- The x-coordinate is constant for all of these points, i.e., x = 2.
- The x-coordinate of any point on this straight line is constant and equal to 2.
- The common property for all of these points on the straight lines is x and the straight line may be denoted by x = 2.
- It is not possible to plot all of the points whose x-coordinate is 2.
- x = 2 is a straight line parallel to the y-axis and is 2 units to the right; it intersects the y-axis at the point (2,0).
x = 2 is a relation and this relation is satisfied by the ordered pairs in which the first coordinate x is always 2 and the second coordinate y is any real number.
Example 2
Plot the following points on a graph sheet.
(-4,0) (-3.0) (-2,0) (-1,0) (0,0) (1,0) (2,0) (3,0) (4,0) (5,0).
What do you notice?
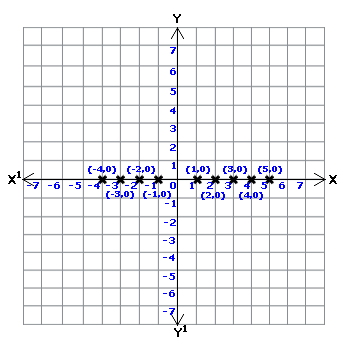
- When all of these points are plotted on a graph sheet, we can observe that they all lie on the x-axis.
- The common property of all of these points is that its y-coordinate is zero.
- The straight line joining all of these points may be denoted as y = 0.
- The y-coordinate on the x-axis is zero. The x-axis may be denoted by the straight line y = 0.
- The ordered pairs whose x-coordinate is a real number and y-coordinate is zero denote the relation y = 0.
Example 3
Draw the graph for y = 4
Solution:
All of the points whose second coordinate y is 4 and whose first coordinate is any real number satisfy this relation. Ordered pairs that satisfy the given relation include (0,4) (1,4) (2,4) (3,4) (4,4) (-1,4) (-2,4) (-3,4) (-4,4).
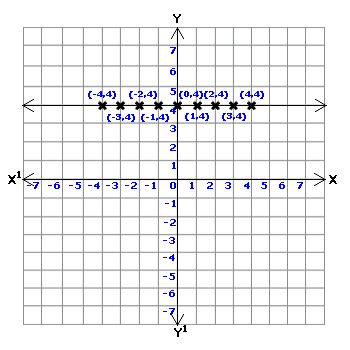
When plotted, these ordered pairs form a straight line that is parallel to the x-axis. This straight-line is represented by y = 4, is parallel to the x-axis and intersects the y-axis at the point (0,4).
Example 4
Plot all of the points on a graph sheet
(0,0) (0,1) (0,2) (0,3) (0,4) (0,5) (0,6) (0,-1) (0,-2) (0,-3) (0,-4) (0,-5) (0,-6)
What do you notice?
Solution:
- All of these points when plotted lie on the y-axis.
- The common property of all of these points is x = 0.
- The x-coordinate of any point on y-axis is zero.
- We can denote the y-axis as x = 0.
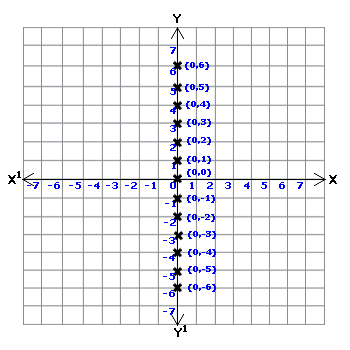
The x-coordinate on the y-axis is zero. The y-axis is denoted by the equation x = 0.
The ordered pairs whose x-coordinate is zero and y-coordinate is any real number satisfy the relation y = 0.
Example 5
Plot the following points on a graph sheet and join them.
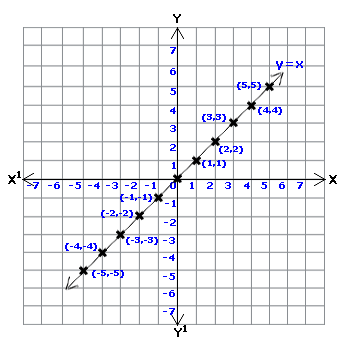
(1,1) (2,2) (3,3) (4,4) (5,5)
(-1,-1) (-2,-2) (-3,-3) (-4,-4) (-5,-5).
Solution:
- All of these points lie on a straight line.
- The points with x-coordinate equal to y-coordinate lie on this straight line.
- This straight line indicates the relation on which x-coordinate is equal to y-coordinate.
- If f denotes the relation, then f = { (x,y) } / x = y and x, y ɛR} is the set-builder form of the relationship.
We have taken the coordinate as integers only for our convenience.
The ordered pairs (1/2, 1/2), (3/2, 3/2) etc. also satisfy the given relation. It is not possible to write all of the ordered pairs that satisfy the relation y = x because the set of ordered pairs is infinite. But all of the ordered pairs, which satisfy the relation, lie only on the straight line.
Observe the following points
- Every ordered pair that satisfies the relation y= x corresponds to exactly one point on the straight line.
- The straight line is called the graph of y = x.
- y = x is the straight line equation.
- The set of ordered pairs satisfying the equation y = x is infinite; the line extends infinitely on either side.
Example 6
Draw the graph for the relation y = 3x where the set of real numbers R is the replacement set for both x and y. find the value of y when x = 1½ using the graph.
Solution:
Determine the ordered pairs that satisfy the relation y = 3x.
X |
2 |
-1 |
1 |
-2 |
3x |
3∗2 |
3(-1) |
3∗1 |
3(-2) |
y=3x |
y=6 |
y=-3 |
y=3 |
y=-6 |
Ordered pairs |
(2,6) |
(-1,-3) |
(1,3) |
(-2-6) |
In the relation y = 3x, substitute the value of x and obtain the corresponding values of y as shown in the table. Since R is the replacement set for both x and y, the set of such ordered pairs is infinite; for convenience, we select pairs that are integers as members.
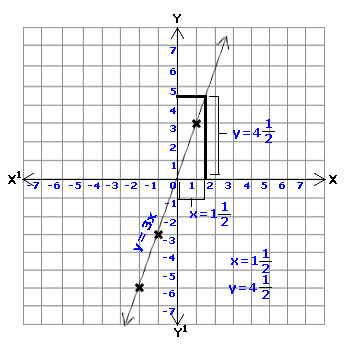
After plotting the points, we can observe the following.
- The points corresponding to these ordered pairs lie on a line.
- The corresponding point of each ordered pair that satisfies the given relation lies on the straight line.
- This straight line is called the graph of y = 3x, and y = 3x is the equation of this line.
Example 7
Draw the graph for relation x + y + 3 = 0 where the set of real numbers R is the replacement set for both x and y.
Solution:
This relation consists of ordered pairs that satisfy the equation x + y + 3 = 0. We have to prepare a table consisting of the ordered pairs that satisfy the equation. Since R is the replacement set for both x and y, the set of such ordered pairs, which satisfies the equation, is infinite. For our convenience, we select pairs that have integers as members.
x + y + 3 = 0
y = -x -3
X |
1 |
-1 |
0 |
-3 |
-x |
-1 |
- (-1) |
0 |
-(-3) |
-x-3 |
-1-3 |
1-3 |
0-3 |
3-3 |
y = -x -3 |
y = -4 |
-2 |
-3 |
0 |
Ordered pairs (x, y) |
(+ 1, -4) |
(-1, -2) |
(0, -3) |
(-3,0) |
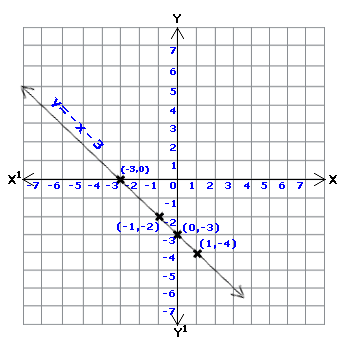
Every point on the line satisfies the relation x + y + 3 = 0.
This straight line is called the graph of x + y + 3 = 0 and x + y + 3 = 0 is the equation for the graph.
The graph of any equation of the form ax + by + c = 0 where x, y belong to R is a line where a and b should not both equal zero at the same time.
For drawing these graphs, ordered pairs of the form (0, a) and (b, 0) are very convenient. To draw any straight line, two points are necessary and to verify the line, another point is necessary.
Linear equations through the graphical method
We can solve simultaneous equations with two variables using graphs.
All of the graphs studied in the last topic were straight lines and these relations are called linear functions. All of these relations are generally written in the form y = m x or y = m x + c.
Slope - intercept form of a linear equation.
The straight lines in the form of y = m x + c are known as slope-intercept forms, where m is the slope and c is the y- intercept of a line.
Example 1
y = x + 3 and y = x -2
Ordered pairs of the graph y = x + 3
x |
0 |
3 |
-3 |
x+3 |
0+3 |
3+3 |
-3+3 |
y= x+3 |
y= 3 |
y=6 |
y=0 |
Ordered pairs
(x, y) |
(0,3) |
(3,6) |
(-3,0) |
Ordered pairs of the graph y = x - 2
x |
0 |
2 |
5 |
x-2 |
0-2 |
2-2 |
5-2 |
y= x-2 |
y=-2 |
y=0 |
y=3 |
Ordered
pairs (x, y) |
(0, -2) |
(2,0) |
(5,3) |
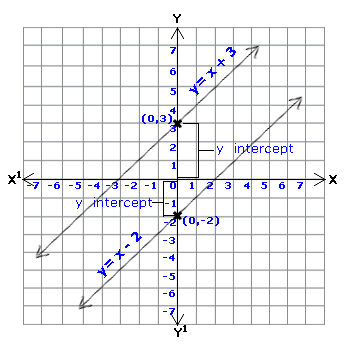
y = x + 3 is a straight line. It intersects the y-axis at (0,3). The distance between the origin and the points of intersection of the straight line with the y-axis is known as the y-intercept and it is equal to the y-coordinate of that point.
The y-intercept for the straight line y = x + 3 is 3.
Observe that the y-intercept for the line y = x-2 is -2.
Example 2
Find the y-intercept for the straight line y = m x + c.
The y-intercept is the second coordinate y that is obtained when the first coordinate x is zero.
y = m x + c
Substitute x = 0
y = m (0) + c
y = c
Therefore, the y-intercept is +c.
Example 3
Find the y-intercept for the straight line y = 4x + 5.
y = 4x + 5
Substitute x = 0 in the equation.
y = 4 (0) + 5
y = 5
Therefore, the y-intercept is 5.
Example 4
Find y-intercept for the straight-line y = 2x.
Substituting x = 0
y = 2(0) = 0.
The y-intercept for the straight line y = 2x is 0 (zero).
Systems of Equations
The graph of a linear equation in two unknown variables is a straight line. Any ordered pair, which satisfies the equation, is a solution.
We have learned about solving simultaneous equations in two unknowns using Algebraic methods.
Now we will learn how to solve simultaneous equations in two variables using graphical methods.
Example 1
Solve the following equations using a graph.
x + y = 3
x - y = 1
Writing the equations in the form y = m x + c
x + y = 3
y = -x +3
x- y = 1
-y =-x + 1
y = x - 1
The ordered pairs for the equation y= -x +3
x |
0 |
5 |
-1 |
-x |
0 |
-5 |
-(-1) |
y= -x +3 |
0 + 3 = 3 |
-5 +3 = -2 |
1+ 3 = 4 |
Ordered pairs
(x, y) |
(0,3) |
(5,-2) |
(-1,4) |
The ordered pairs for the equation y= x-1
x |
1 |
4 |
-3 |
x-1 |
1-1=0 |
4-1 = 3 |
-3 -1 = -4 |
y = x- 1 |
y = 0 |
y = 3 |
y = 4 |
Ordered pairs (x, y) |
(1,0) |
(4,3) |
(-3,-4) |
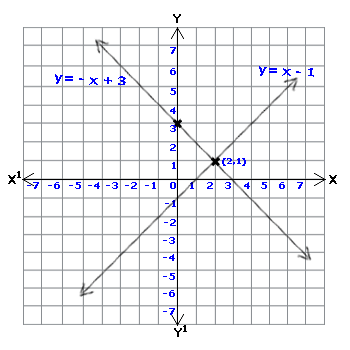
The straight lines x + y = 3 and x- y = 1 intersect at the common point (2,1).
If these equations are solved algebraically we get x= 2 and
y = 1. Therefore, (2,1) is the solution.
If the solution is unique for a system of linear equations, then these equations are called consistent systems of equations. There is only one point in common for these lines.
If the slopes of the equations are equal and their y-intercepts are equal, then these lines are parallel to each other. This implies that these straight lines have no point in common. These systems of equations are known as an inconsistent system.
Try these questions
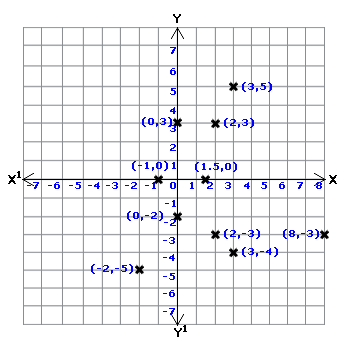
Draw the set of axes on to the same graph sheet and plot the ordered pairs.
- (2,3)
- (-1, 0)
- (0, -2)
- (-2, -5)
- (3, -4)
- (2.-3)
- (8,-3)
- (1.5.0)
- (3,5)
- (0,3)
Answer
Name the quadrant containing the following ordered pairs
- (5,6)
- (-3,8)
- (8, -5)
- (6,9)
- (7, -4)
- (10,4)
- (20, -13)
- (-10, -20)
Answer
| S. No |
Ordered Pair |
Quadrant |
1. |
(5,6) |
Q1 |
2. |
(-3,8) |
Q2 |
3. |
(8, -5) |
Q4 |
4. |
(6,9) |
Q1 |
5. |
(7, -4) |
Q4 |
6. |
(10,4) |
Q1 |
7. |
(20, -13) |
Q4 |
8. |
(-10, -20) |
Q3 |