The domain can be represented as a set of values that map to a particular value in the range of the function.
Consider the following relation between year and profit % of a company.
Year (x) |
Profit/ Loss % (y) |
2001 |
20 |
2002 |
15 |
2003 |
30 |
2004 |
-10 |
2005 |
-5 |
2006 |
10 |
The above relation has year as its domain and profit/loss% provides the set of values for range. The domain values are mapped to range values as shown below
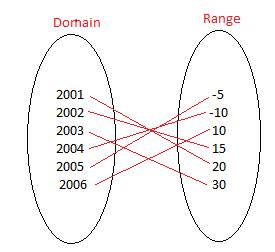
Domain is also called a pre-image that maps to a value in the image. A way to express the mapping between domain and range of the above relation R between the year and the profit made in that year is:
R (2001)=20 would mean year 2001 had a profit of 20%
;R (2002)=15; R(2005)=-5 etc.
The above relation can also be represented as the following set:
R= {(2001, 20), (2002, 5), (2003, 30), (2004, -10), (2005, -5), (2006, 10)}
One to one functions
If each value in the domain maps to a unique value in the range, then it is called a one to one relation. Mathematically it means if f (a)=f(b) where a and b are some values in the domain of function f, then a has to be equal to b, otherwise it would mean more than one value in the domain map to the same value in the range.
Example
Does the following relation represent a function?
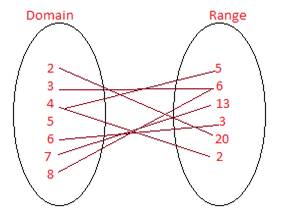
Answer:
No it doesn’t represent a function because “4” in the domain maps to 2 values
1. R(4) = 5
2. R(4) = 2
According to the definition of function, each value in the domain must map to a single value in the range.
Example:
The graph below shows the relation between the speed of a vehicle and time in the interval 0 to 10 hours. Find the domain and range of the function represented by following graphical relation.
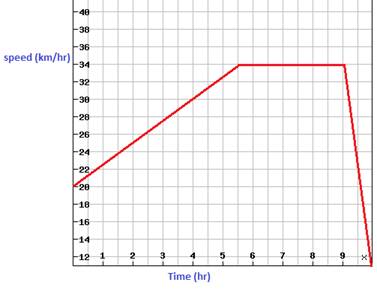
Answer:
In the given graphical representation, the range of speed depends on the time interval. If t represents the time and s represents the speed, then
- For t=0, Range of Speed: s=20 km/hour.
- For 0< t < 5.5 hrs, Range of Speed: 20 < s < 34 km/hour
- For 5.5=< t < 9, Range of Speed: s=34 km/hour.
- For 9< t<=10, Range of Speed: 0<=s<34
This type of functional relationship where the range of the dependent variable is defined for different intervals of the independent variable is called piecewise function. As the name suggests, the function is divided into pieces depending on the values of x (or independent variable)
Functions in Real Life
Why is water flowing through the pipe so slowly? Let’s understand the situation with the help of functions and the following illustrative example.
A simple illustration of the function is:

This is a pipe through which water flows. The amount of water that flows through this pipe depends on the size of opening in the pipe. If the opening is narrow, the amount of water flowing through will be correspondingly less. When you have a broader opening, the amount of water that flows through will be greater. Here, if the size of pipe opening is x and the amount of water flowing through the opening is y. Then, writing a function of x and y will be like this.
y = f(x).
Example
The speed of the car increases by .5 km/hr after every 30 minutes. What are the dependent and independent quantities here?
Answer:
Speed of car is the dependent parameter that depends on time and time being an independent quantity.
Discrete Vs Continuous Functions and their Graphs
There are two important types of data to be considered while plotting a graph:
Below is the record of percentage of students who passed for different years for a high school in New York.
| Year |
% of student passed |
2006 |
98 |
2007 |
100 |
2008 |
92 |
2009 |
98 |
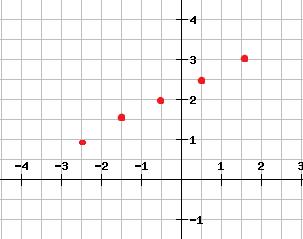
This information can also be represented in graphic form as a bar chart or as the graph shown below.
When the graph of a relation has just the collection of points which cannot be connected through a smooth line or curve, that type of function is called discrete. Here the information is presented only for discrete years 2006, 2007 and so on. The information regarding the value between any two years is irrelevant and cannot be calculated on the basis of the given plot. In a discrete graph, the data values are discrete i.e. non continuous.
Continuous functions
When the graph of a function has points that can be connected to form a smooth curve or a straight line, the function is called a continuous function. Here the domain of the function consists of continuous values and not discrete or non-continuous values.
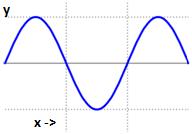
This is an example of a continuous function.
Example
Does the following graph represent a continuous or discrete function?
Answer:
Discrete
Try these questions
- Consider the two relations below:
Relation 1: {(0, 2), (1, 5 ), ( 5,9) }
Relation 2: {(1, 5), (1, 0), (3, 5)}
Which one of these is a function?
Answer: Relation 1 is a function.
- Identify which relation is a function.
R 1 = { a, b), ( a,c), ( b, d), ( d, f)}
R 2 = { ( a, 0), ( c, 1), ( d, 5), ( e, 2)}
Answer: Relation 2 is a function.
- An example of a functional relationship where time is a dependent quantity is.
- Speed of a vehicle with time
- The increase in energy of a falling object with time.
- The time taken to answer the questions Vs number of questions
- The increase in population with time.
Answer: C
- The number of boxes that can fit into a carton depends on the size of the carton and the size of the carton depends on its price. Which of the following will be true?
- The number of boxes per carton depends only on the carton size.
- The number of boxes per carton depends only on the price of carton.
- The number of boxes per carton depends on size of the carton and its price both.
- The number of boxes per carton depends on either the size of the carton or price.
Answer: C